Free Trading Indicators
Professional-grade indicators at zero cost. Start your trading journey with our complete collection of free tools.
🎁 100% FREE - No Credit Card Required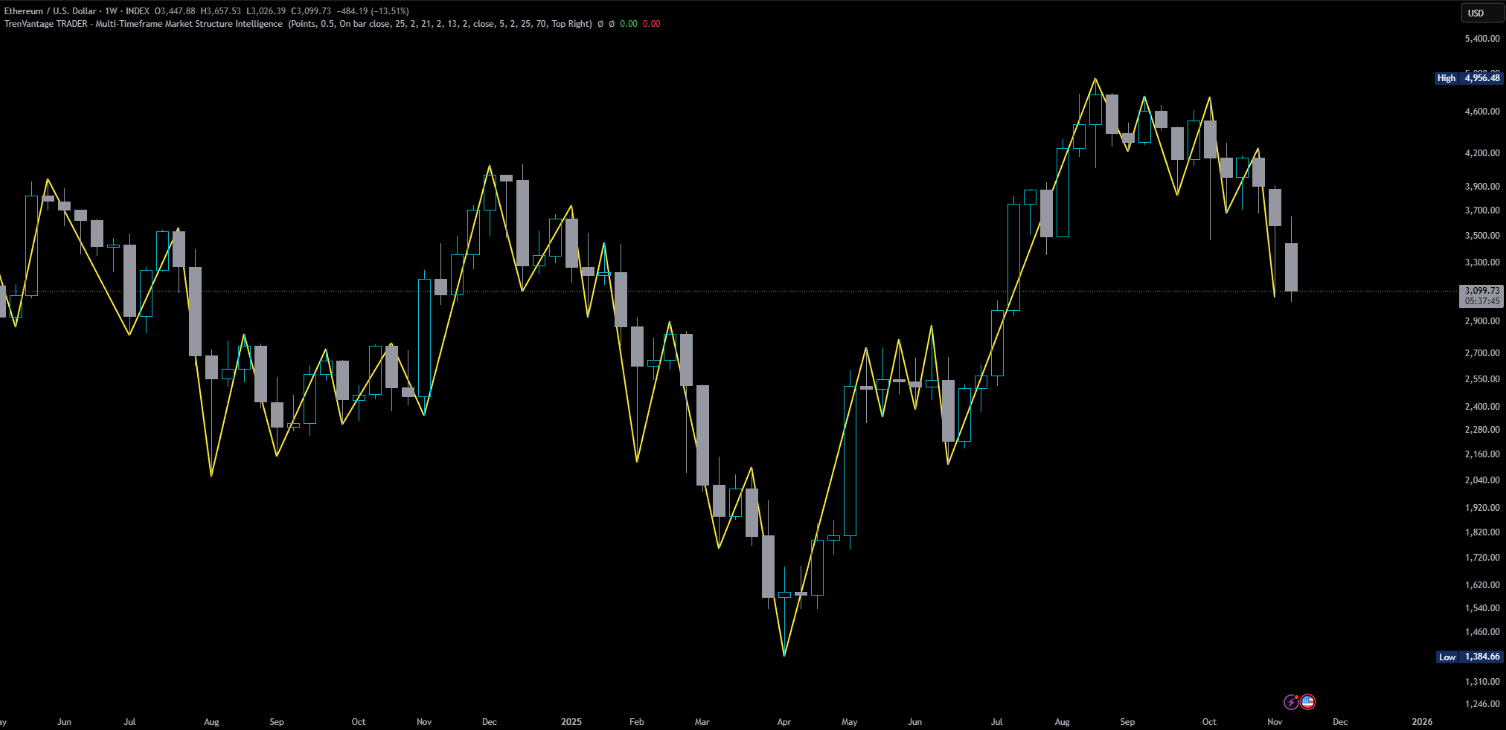
TrenVantage LITE
Smart Trend Detector
Automatically identifies trend direction, price changes, and swing data. Perfect for beginners.
- Advanced Trend Detection
- Visual Analysis Tools
- Smart Alerts System
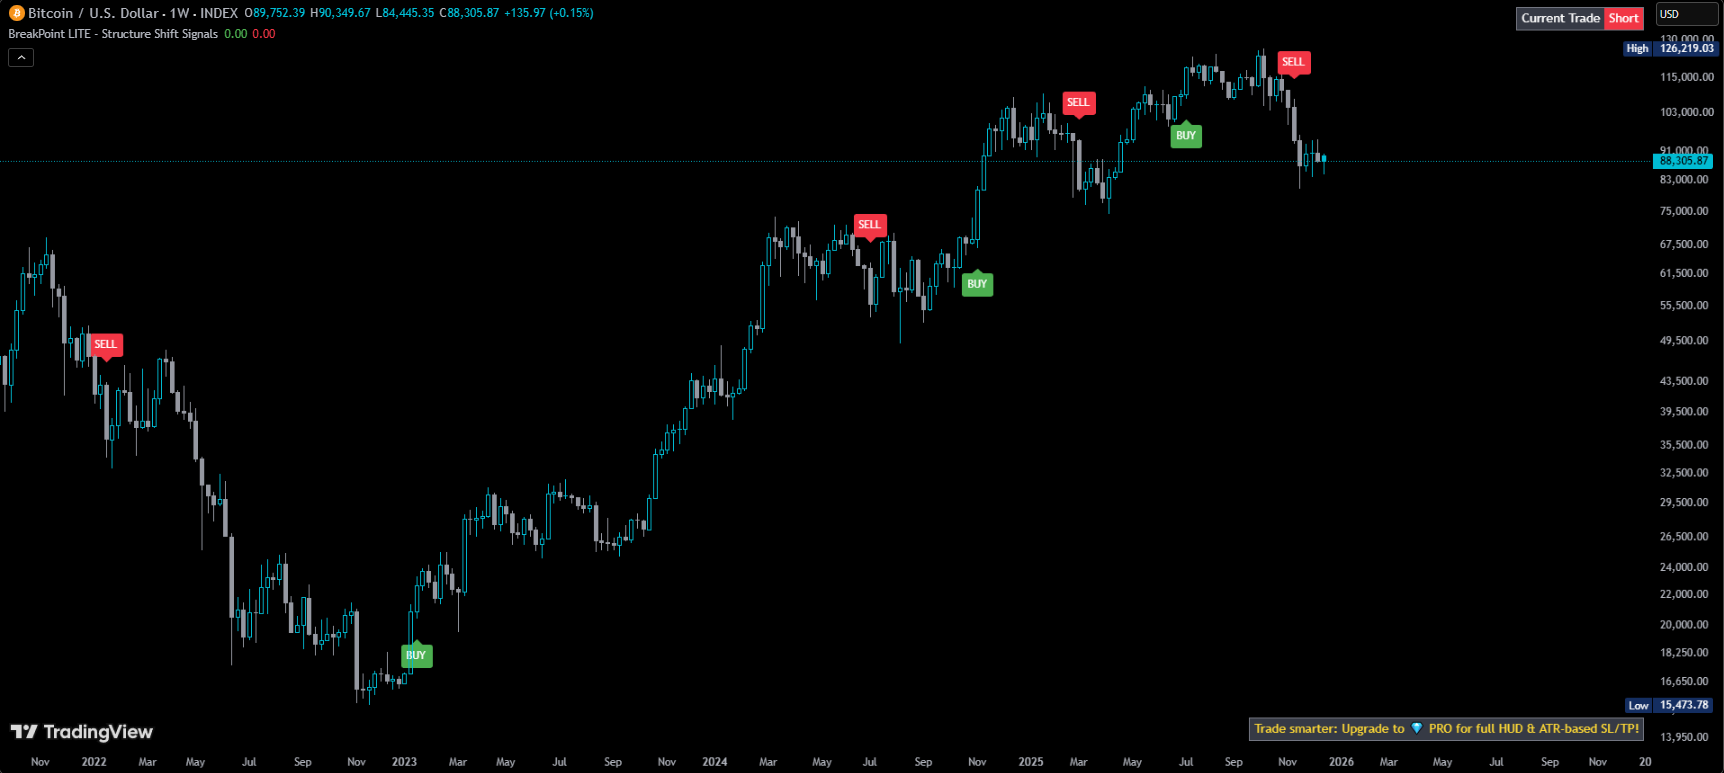
BreakPoint LITE
Market Structure Shift Signals
Spot market structure shifts instantly and trade with clarity
- Swing high/low detection
- EMA & RSI Trend Filters
- On-Chart BUY/ SELL Signals
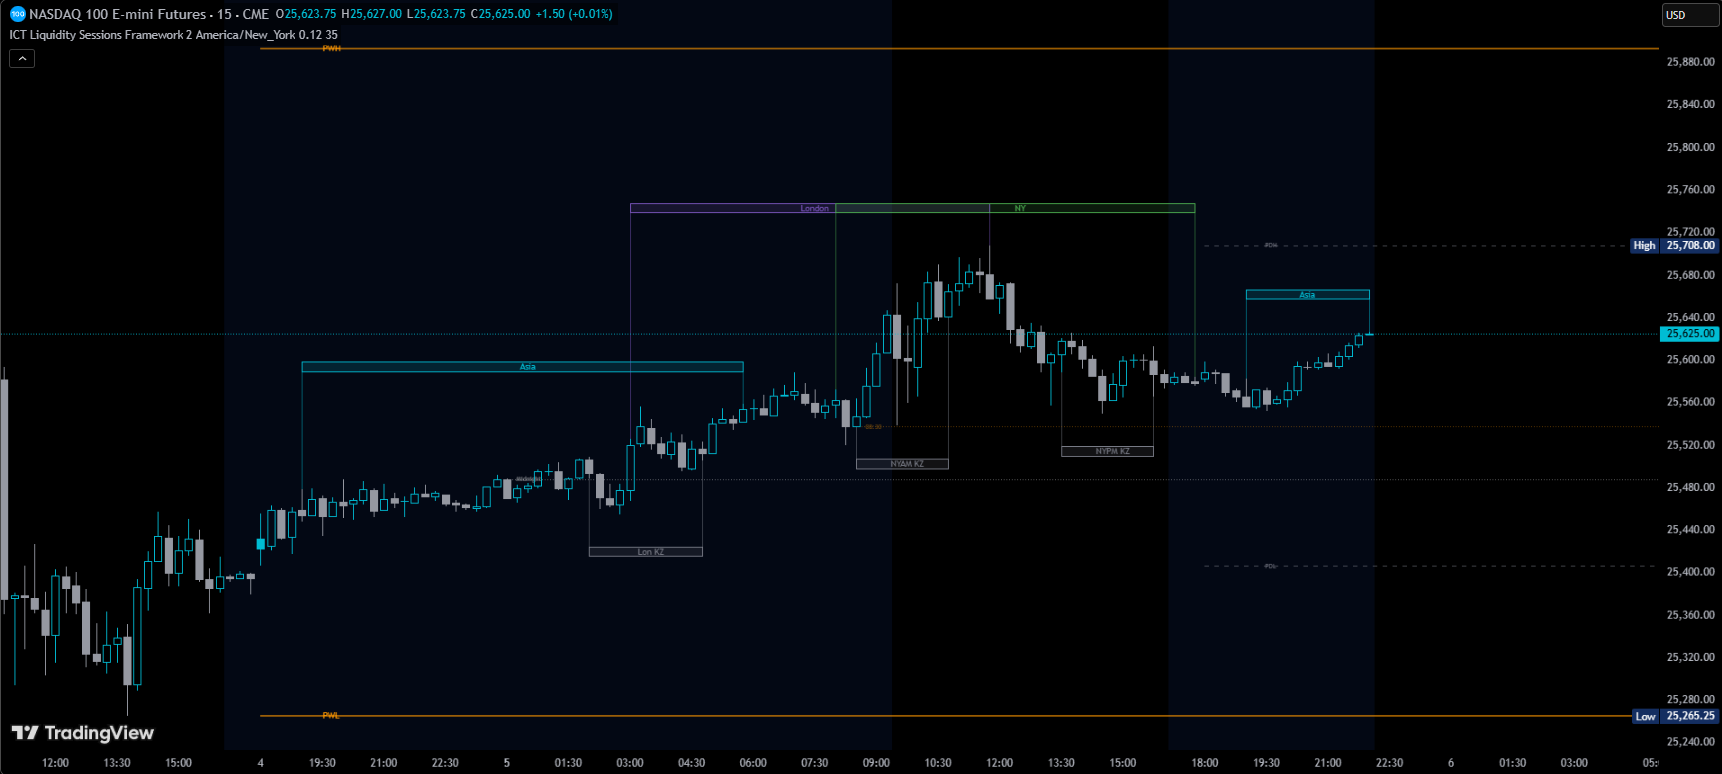
ICT Liquidity Sessions Framework
ICT Sessions Framework
A clean, session-based ICT framework that maps institutional liquidity through global sessions, killzones, and higher timeframe levels.
- Global Trading Sessions
- ICT Killzones
- Higher Timeframe Liquidity Levels
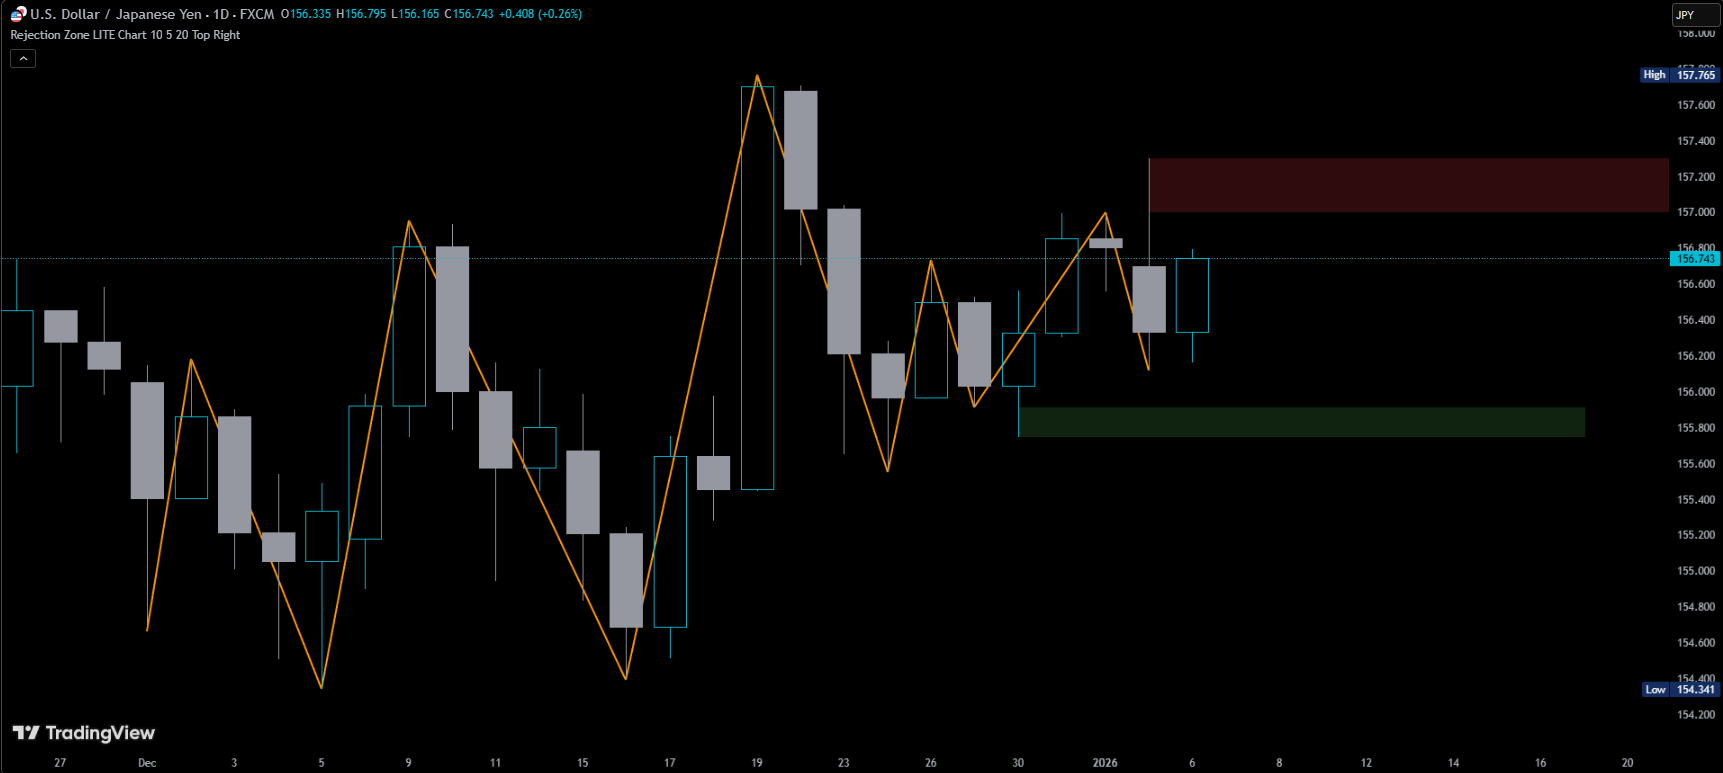
ICT Rejection Zone LITE
Liquidity Rejection Zones
Observe market sweepts, swing bias, and trend structure, building intuition for professional SMC/SMT setups
- Bullish & Bearish Rejection Blocks
- Trend Detection
- Mitigated Blocks and Zone Lifespans
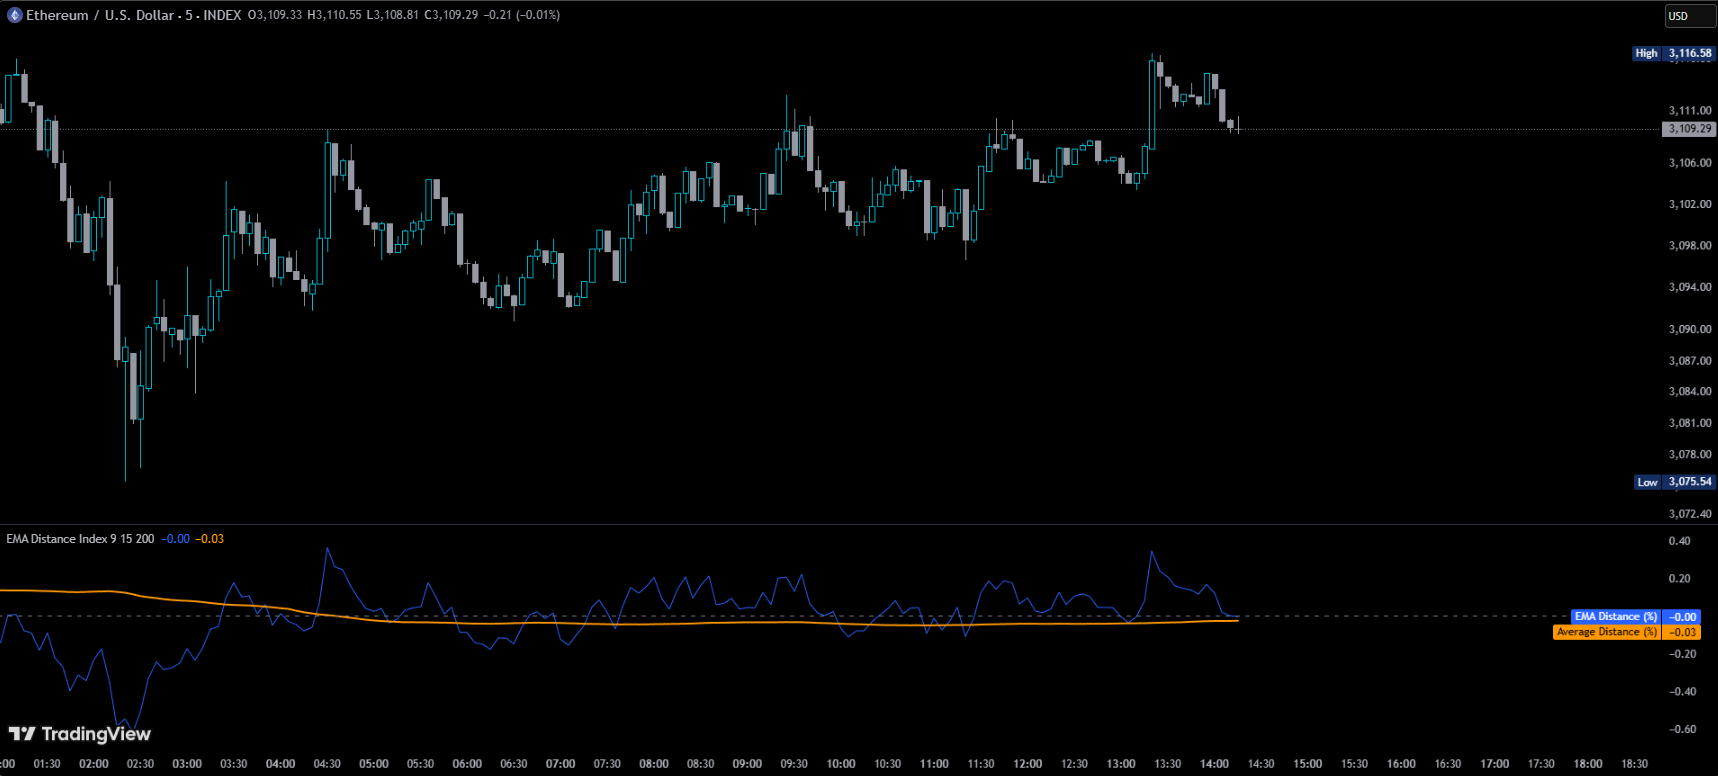
EMA Distance Index
Momentum Divergence Alerts
Measures how far price is extended from a structurally important EMA.
- Timeframe Agnostic (works on any timeframe)
- Customizable EMA Timeframe
- Percentage Based Volatility Awareness
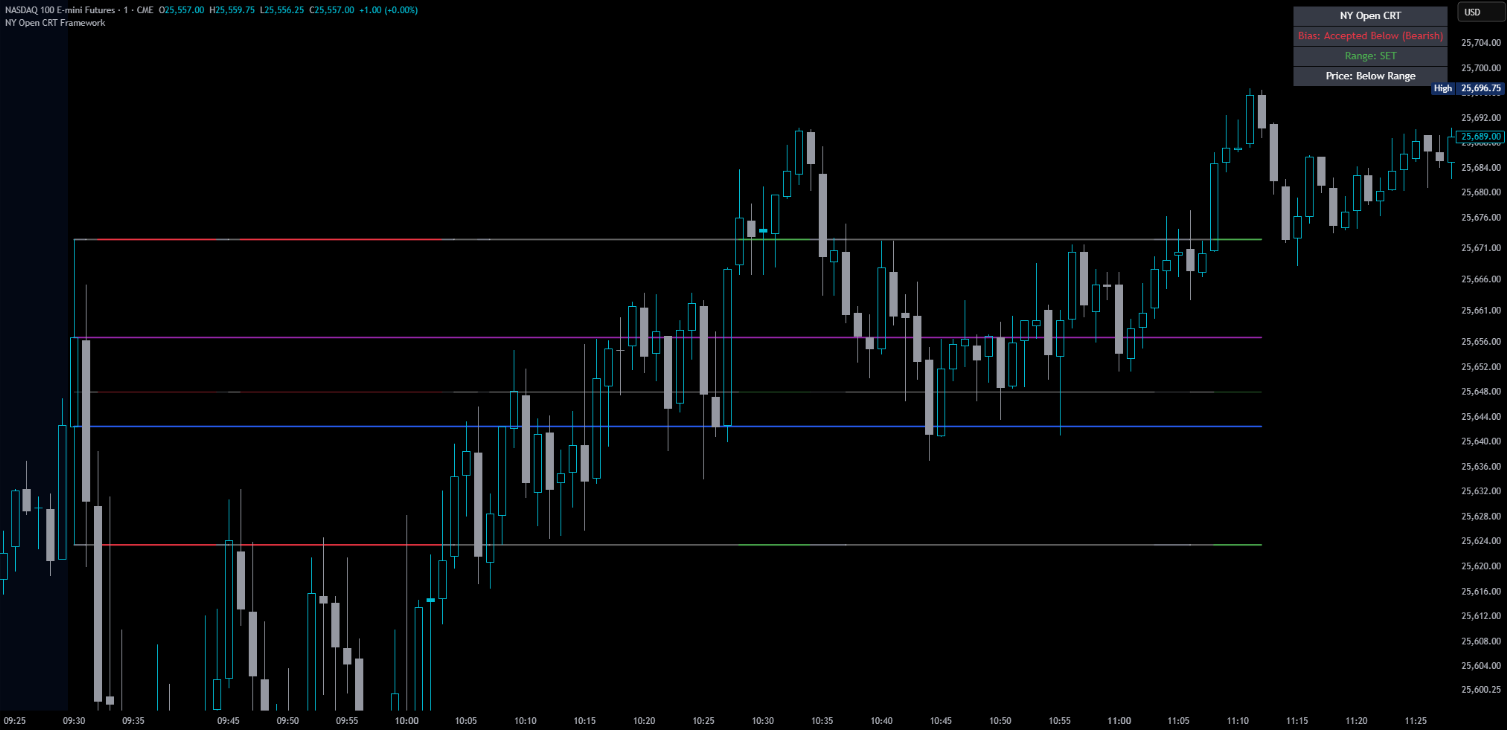
NY Open CRT Framework
Candle Range Theory
NY Open candle range and its levels are locked in to determine daily bias
- CRT Range Levels
- CRT Acceptance & Failure Logic
- HUD/ Status box
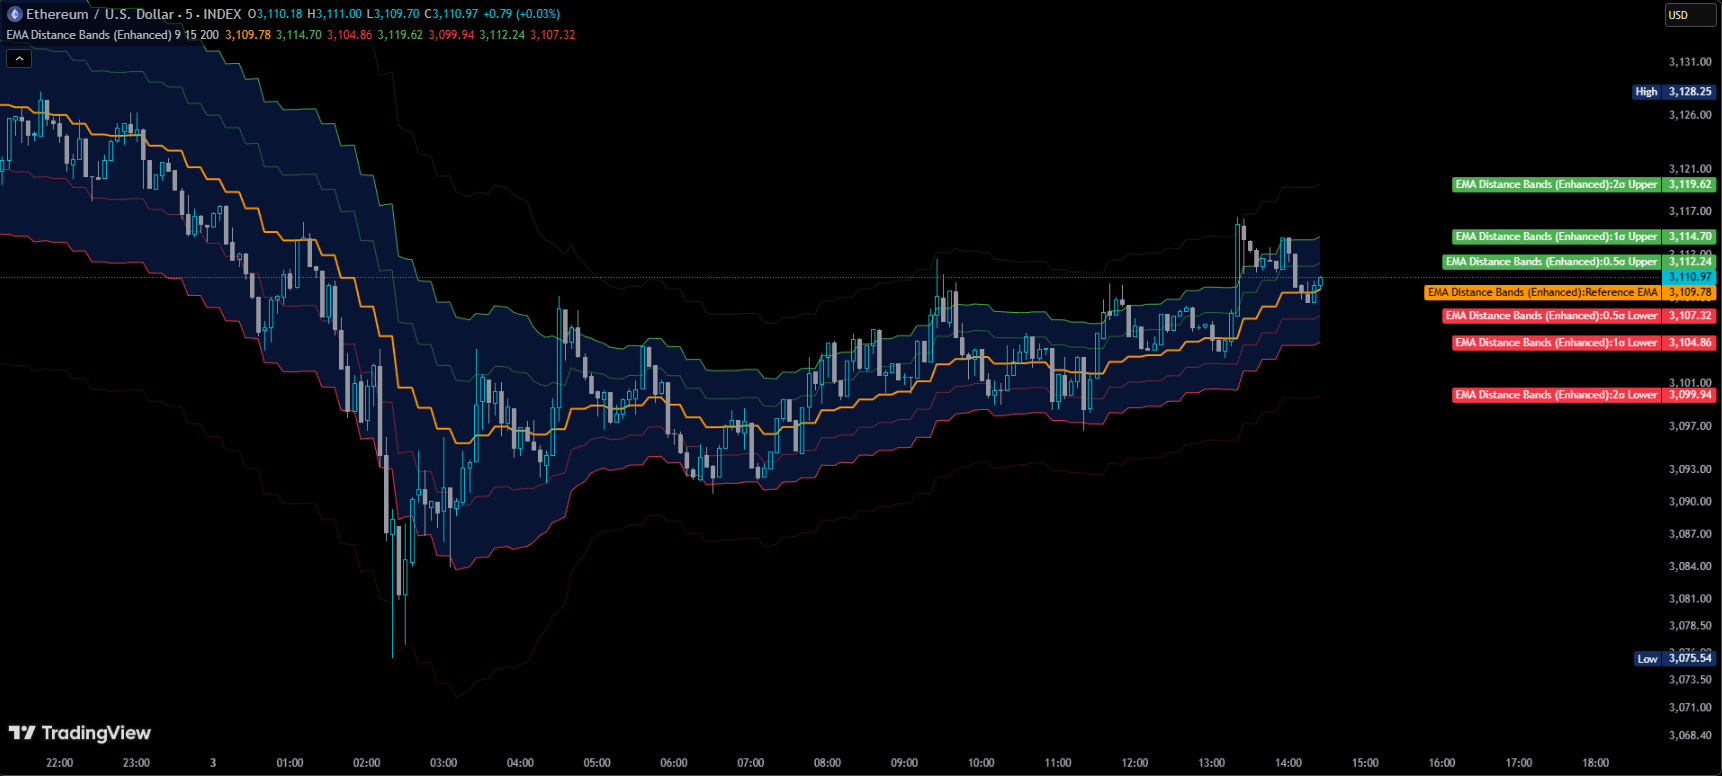
EMA Distance Bands
Exponential Moving Average Bands
Tiemframe agnostic EMA represents normal vs extreme price behavior.
- Multi Timeframe EMA
- 0.5σ, 1σ, 2σ Standard Deviation Bands
- Dynamic shading of normal range
Fibonacci Auto
Automatic Fib Retracements
Automatically draws Fibonacci retracement levels based on recent swing highs and lows.
- Auto swing detection
- All major fib levels
- Extension levels included
Order Flow Basics
Simple Order Flow Analysis
Basic order flow imbalance detection for understanding buying and selling pressure.
- Delta calculations
- Imbalance highlights
- Absorption detection
Trend Cloud
Dynamic Trend Visualization
Cloud-based trend indicator showing market direction with dynamic color changes.
- Multi-MA cloud
- Trend strength colors
- Entry/exit zones
Breakout Scanner
Range Breakout Detection
Identifies consolidation ranges and alerts on breakouts with volume confirmation.
- Auto range detection
- Volume breakout confirm
- False breakout filter
ATR Bands
Volatility-Based Levels
Dynamic support and resistance bands based on Average True Range volatility.
- ATR multiplier bands
- Dynamic stop loss levels
- Volatility squeeze alert
Ready to Level Up?
While our free indicators are powerful, our premium tools offer advanced features, multi-timeframe analysis, and priority support.